
Grasshopper Tutorial 2: Climate Analysis
In addition to being a great iterative design tool, Grasshopper for Rhino can produce beautiful climate analysis diagrams. This tutorial will walk you through creating a wind rose, psychometric chart, and a 3D sun path using Ladybug in Grasshopper. (Why all the animal names? I really really don’t know…) Grasshopper climate analysis is an easy way to add a level of professionalism and customization to your architecture projects.
If you are unfamiliar with Grasshopper, check out my basics tutorial here first.
Step 1: Install Ladybug
Ladybug is a plug-in for Grasshopper that you can download here at Food4Rhino and follow the video on their website to install it.
Step 2: Download an .epw Weather File
You’ll need a .epw weather file for the location that you want to analyze. I like using EnergyPlus to get my weather data.
Step 3: Launch Ladybug
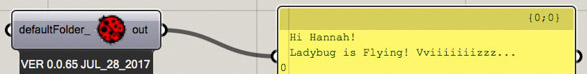
Open Grasshopper and start by double clicking in the canvas and typing “ladybug_ladybug”. If you connect a panel to it, it will give you a cute little “Ladybug is Flying! Vviiiiizzzz…” message so you know Ladybug is up and ready to go! DONT FORGET THIS because if you don’t have the “ladybug_ladybug” component, NONE of your ladybug components will work!!
Step 4: Set File Path
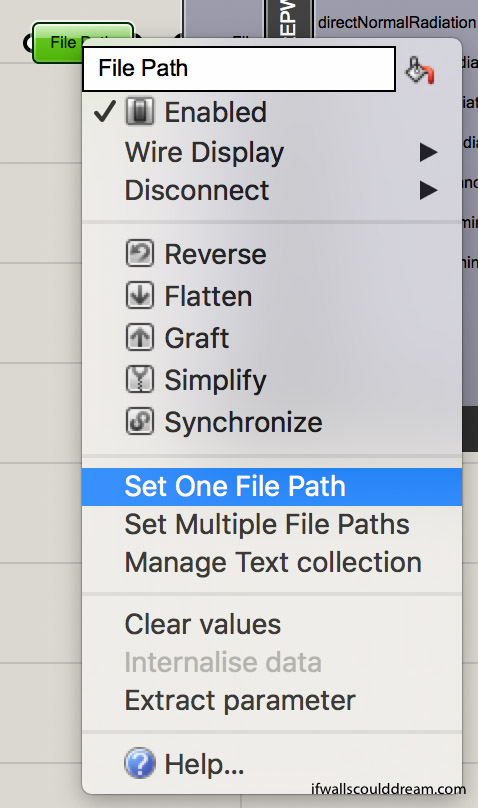
Next, add a “file path” component on the left side of your canvas. To link your .epw file, right click on the “file path” and select “set one file path” and then select the .epw file you just downloaded.
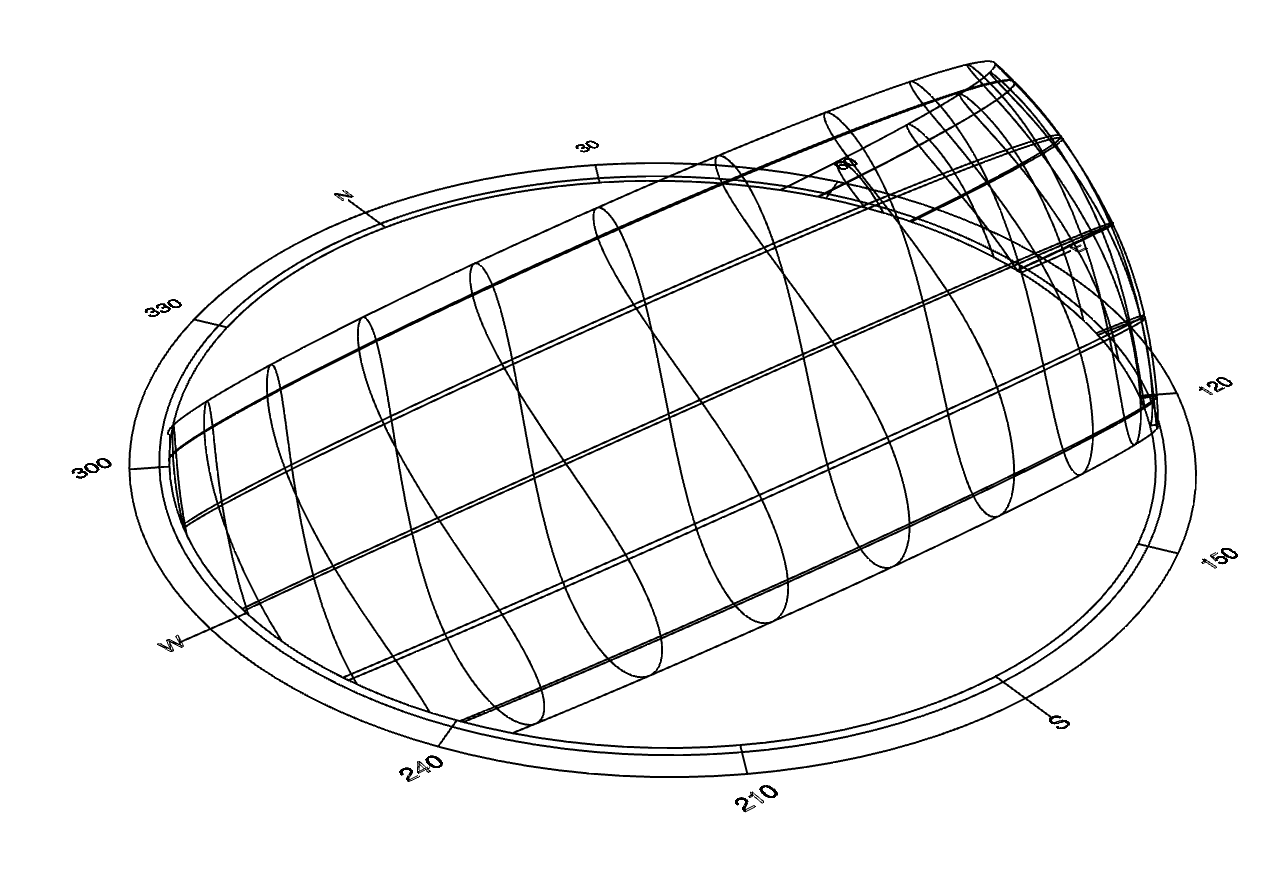
Step 5: Sun Path
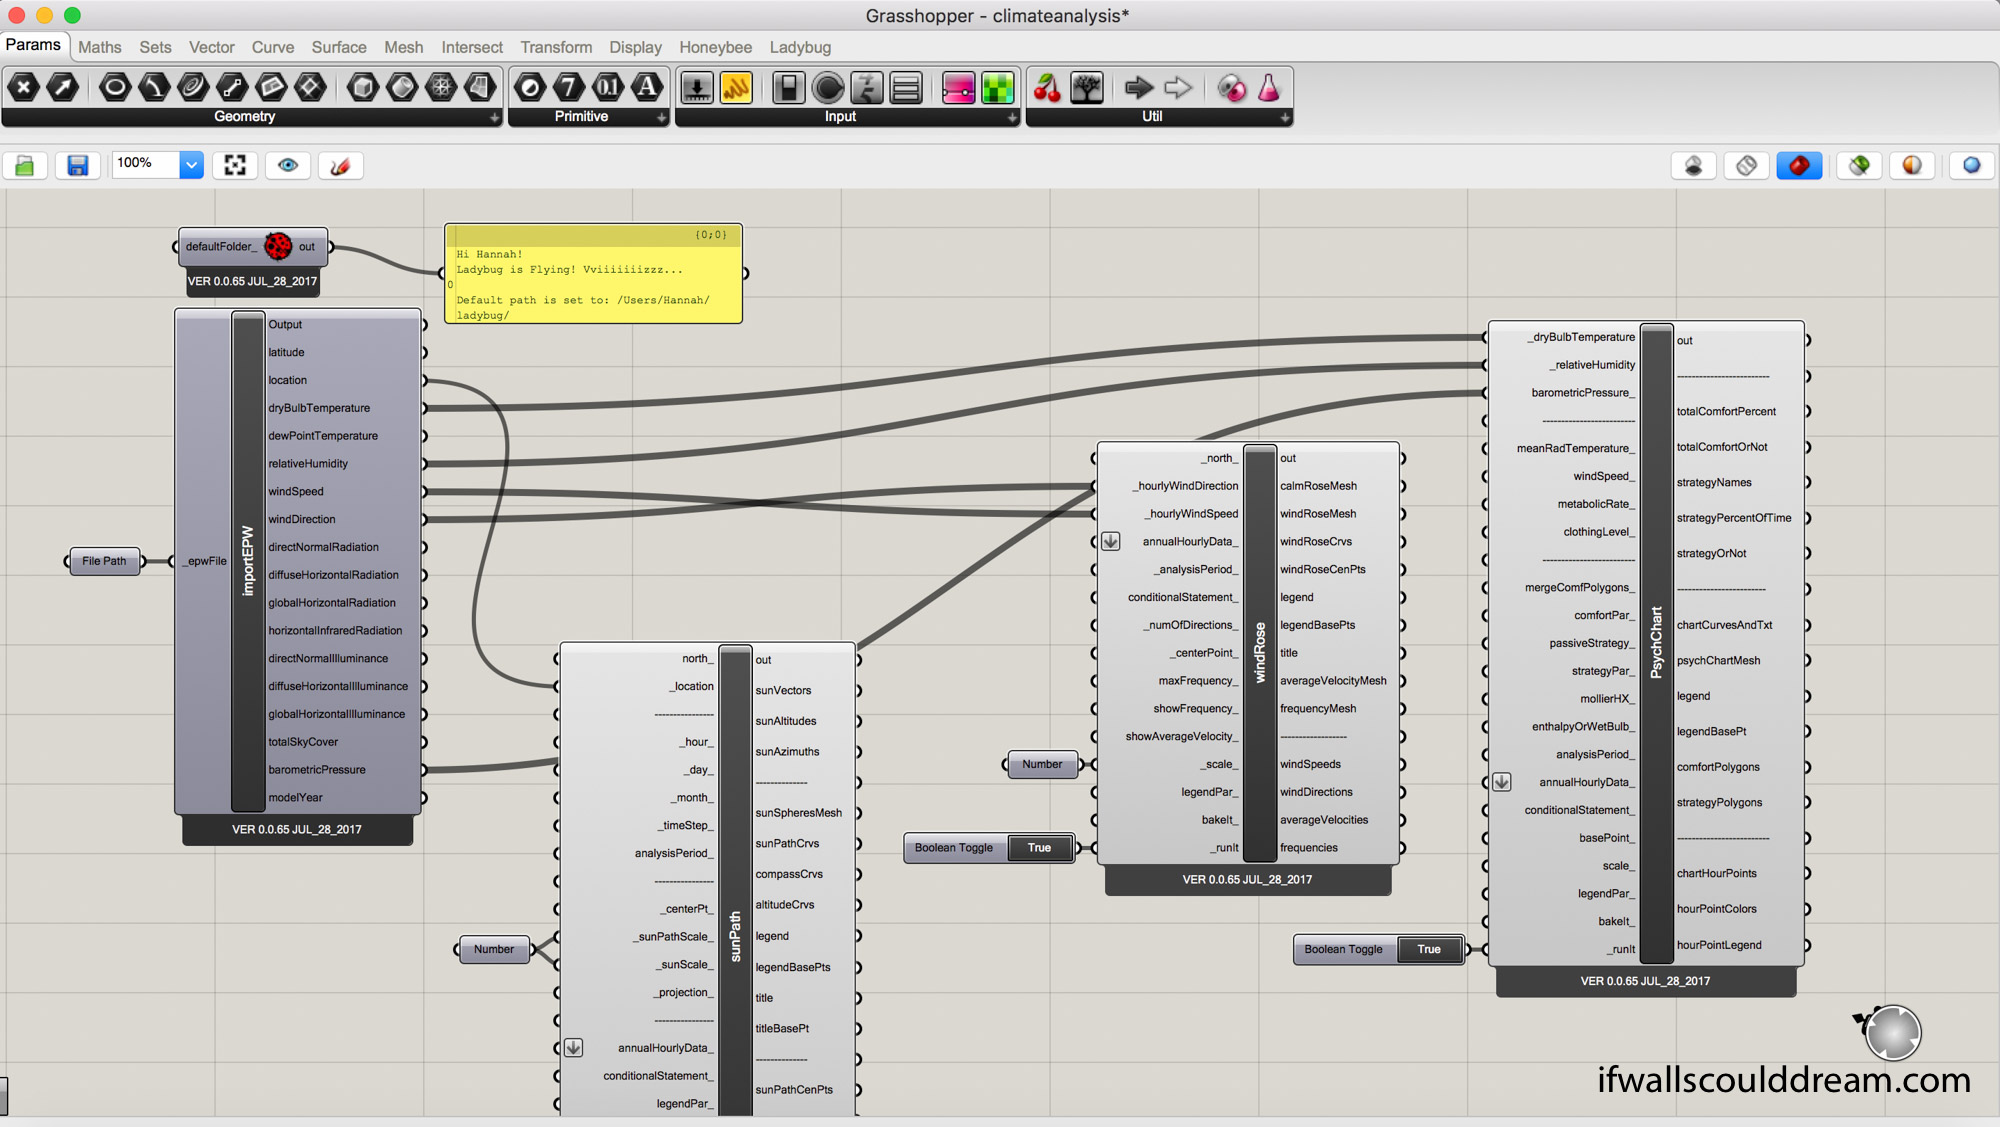
Add a “ladybug_import EPW” component connected to the “file path” and then add a “ladybug_sunpath” component. All you have to connect is the “location” from “importEPW” to “sunPath”. If you want to reduce the scale of the “sunPath” you can add a “number” component and set a number less than 1.
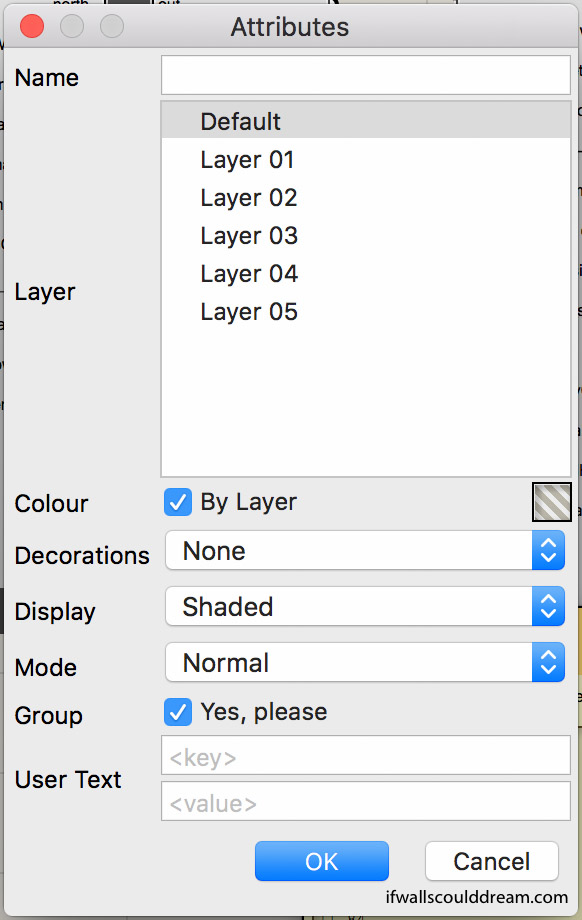
When you bake your ladybug components, I have found it useful to group them and make sure that the display is set to shaded.
Here is what the Sun Path looks like when it’s finished:
You can add your own geometry or a render below it and put it on a site plan like this:
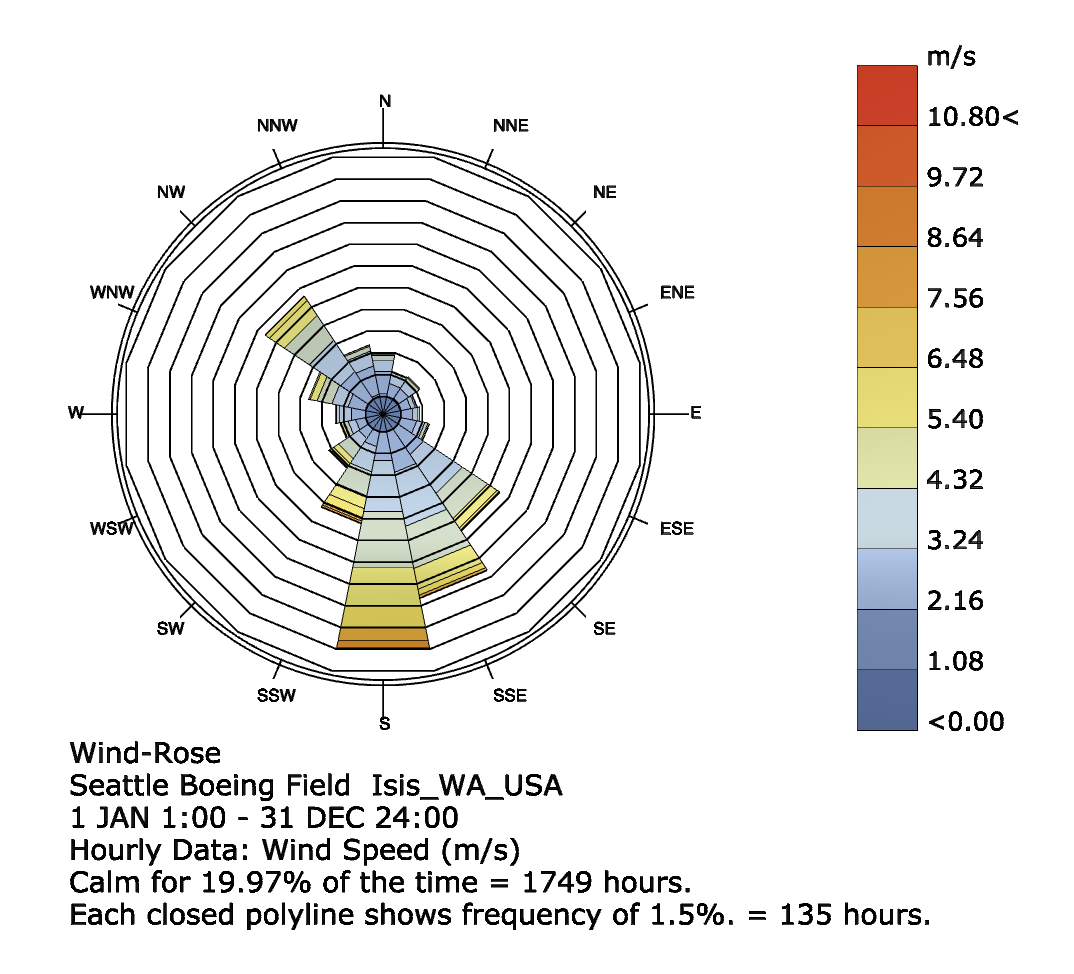
Step 6: Wind Rose
Add a “ladybug_windrose” component. Connect windSpeed and windDirection from “importEPW” to “windRose”. If you want to reduce the scale, you can add a “number” component and set a number less than 1. Add a boolean toggle to _runit and turn it to true.
This is what it will look like once you bake it:
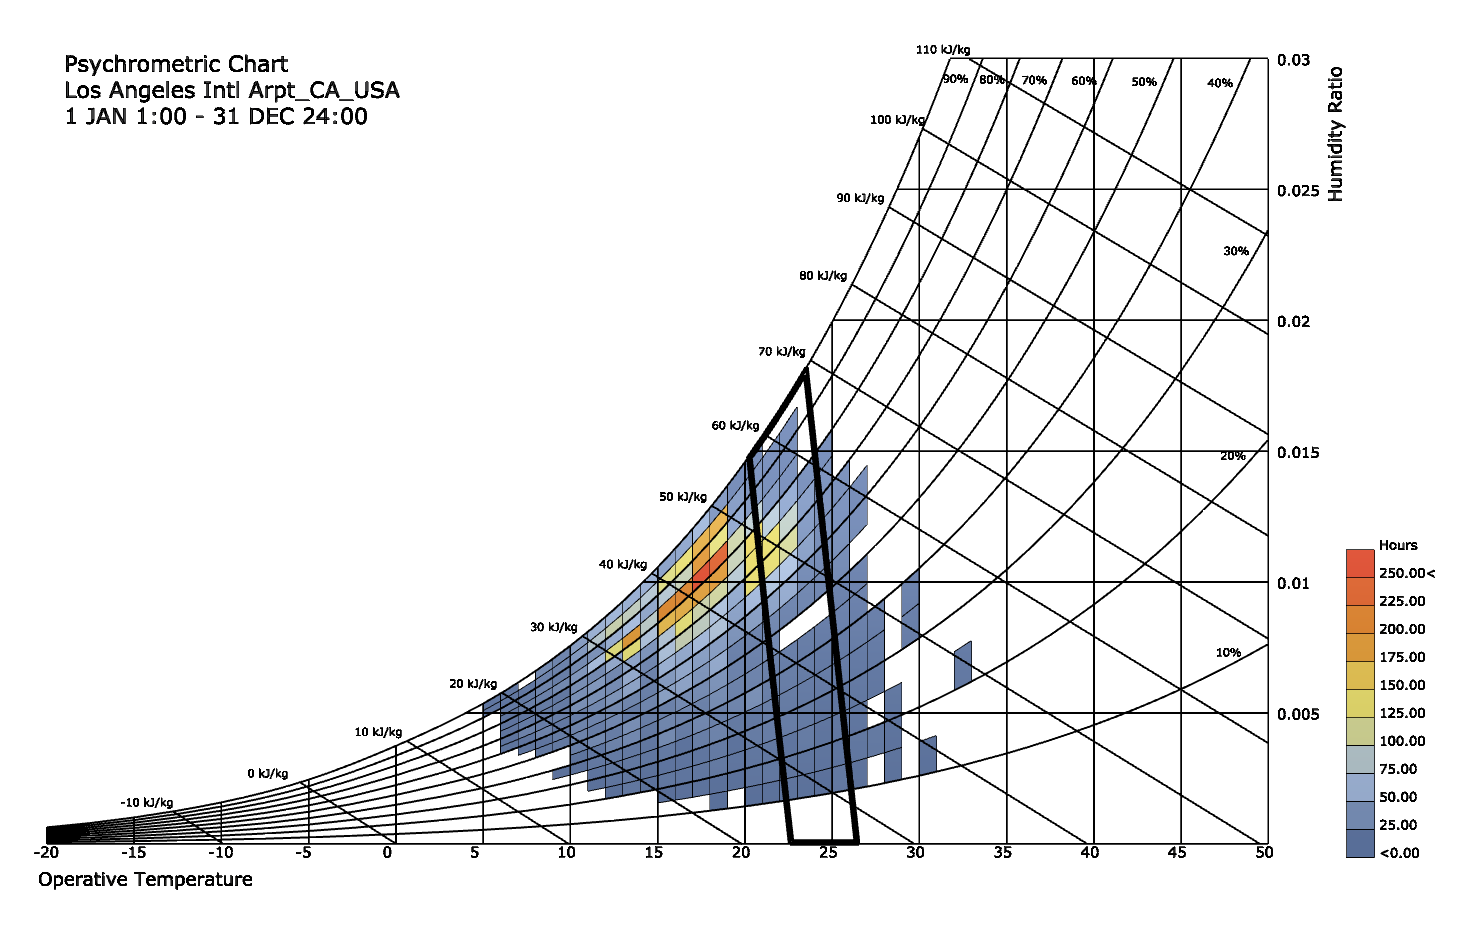
Step 7: Psychometric Chart
Add a “ladybug_psychChart” component. Connect dryBulbTemperature, relativeHumidity, and barometricPressure from “importEPW” to “PsychChart”. Add a boolean toggle to _runit and turn it to true.
This is what it will look like once you bake it:
If walls could dream… they’d dream of ladybugs and grasshoppers.